Facebook Ad Metrics Mastery 2024: Your Guide to Data-Driven Success
So, you've poured your heart and soul into creating eye-catching visuals, perfecting ad copy, and testing out various bidding strategies. The last thing you need is to exhaust yourself by managing heaps of data across multiple clients. That's the reality for many marketers out there. This guide is here to show you the fastest way to handle your reporting and introduce you to some of the most crucial Facebook Ad metrics you should be keeping an eye on. Let's dive in and uncover the secrets to boosting your ad results without burning out.
Understanding Facebook Ad Metrics
Before we get started, let's make sure we're on the same page. Facebook Ads metrics are the numbers that tell you how well your paid ads are performing on the platform. Whether you're aiming for more traffic, snagging new leads, or upping your ad spend, these metrics are your compass.
Before diving into the world of Facebook Ad metrics, it's crucial to establish clear campaign objectives. Are you aiming to increase brand awareness, generate leads, drive sales, or promote app installs? Each objective requires a different set of metrics to effectively measure success. For example, if your goal is brand awareness, metrics like reach and impressions will be more relevant than conversion metrics.
13 Essential Metrics for Facebook Ads
Performance and Cost Metrics
1. Cost per Click (CPC)
Cost-per-click (CPC) represents the amount you pay for each click your ad garners on the social media giant's platform.
As you orchestrate your advertising strategy on Facebook, it's not just about the grand spectacle of your total budget. Instead, let's spotlight the elegance of CPC. This metric becomes your dance partner, guiding you to assess whether your investment is pirouetting in the right direction, creating an impactful rhythm, or perhaps swaying into unnecessary extravagance.
Monitoring CPC helps you understand your ad spend efficiency and optimize your bidding strategies.
2. Cost per Result
Beyond the primary goal, tracking the cost of other conversions in your funnel is essential. This metric helps identify potential targeting or creative issues, ensuring you optimize your efforts where needed.
3. Cost per Mille (CPM)
CPM refers to the cost of reaching 1,000 impressions with your ad. It's a relevant metric for brand awareness campaigns where visibility is a primary goal.
4. Click-Through Rate (CTR)
CTR measures the percentage of users who clicked on your ad after seeing it. A higher CTR indicates a more relevant and engaging ad.
Don't mix this up with other interactive actions like sharing, liking, or commenting.
In this scenario, you'll be linking your social media post to additional content, such as a blog post or a shopping website, with the hope that viewers will click on it.
Conversion Metrics: Evaluating Campaign Effectiveness
5. Return on Ad Spend (ROAS)
ROAS measures the revenue generated for every dollar spent on advertising. It's a crucial metric for assessing the overall return on your ad investment.
6. Conversions
Conversions refer to the specific actions you want users to take after seeing your ad, such as making a purchase, signing up for a newsletter, or downloading an app.
7. Conversion Rate
This metric measures the percentage of users who completed a desired action after clicking on your ad. A higher conversion rate indicates a more effective campaign.
Engagement Metrics: Measuring Audience Interaction
8. Clicks
This metric tracks the number of times users have clicked on your ad, including clicks on links, images, videos, or calls to action. Analyzing click data helps you understand which ad elements are resonating with your audience.
9. Likes, Shares, and Comments
These metrics reflect the level of audience engagement with your ad content. They provide valuable insights into how well your message is resonating and sparking conversations.
10. Video Engagement Metrics
For video ads, metrics like video views, watch time, and completion rate offer deeper insights into how users are interacting with your video content.
Awareness Metrics: Gauging Your Reach and Visibility
11. Frequency
Frequency is the average number of times each Accounts Center account saw your ad.
A frequency of 1.0 means one person saw your ad once. However, if the frequency increases to 1.3-2.0, it implies that, within that audience, customers will see your ad 2 to 3 times. This might indicate disinterest or previous purchase, and Facebook may view high frequency as disruptive, potentially leading to increased costs and spamming customers.
Especially with smaller customer pools, this frequency ratio tends to rise. That's why targeting deeply with a small audience may work well initially, but as days go by, costs can soar. A small audience can face increased auction competition and audience saturation.
12. Reach
This metric indicates the number of unique users who have seen your ad at least once. It helps you understand the potential audience size your campaign is reaching.
13. Impressions
Impressions refer to the total number of times your ad has been displayed, regardless of whether users clicked on it or not. This metric provides insights into your ad's overall visibility.
Different Metrics for Specific Campaign Goals
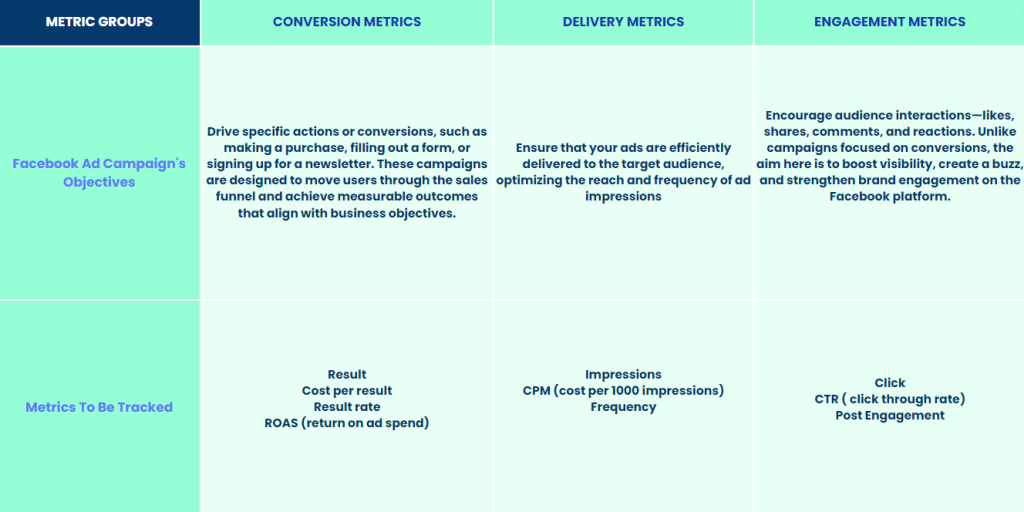
Understanding the distinct metrics tailored to specific campaign objectives is crucial for marketers aiming to optimize their strategies.
Whether your goal is to boost engagement, drive conversions, or enhance brand awareness, the table below provides insights into the key metrics that are likely to matter most for each unique campaign objective.
Step-by-step Guide to Creating Custom Facebook Ad Metrics
Facebook provides a multitude of metrics in Ads Manager, but what if those don't quite meet your needs? Now, Facebook lets you create custom metrics right in Ads Manager, a feature previously tucked away in Ads Reporting. Let's navigate where to find and create these custom metrics.
Creating Custom Metrics
In your Ads Manager, click on the "Columns" dropdown and select "Customize Columns."
To craft a custom metric, click "Create Custom Metric" on the right side of the search box to initiate a pop-up dialog.
Then, you will have a pop up box where you can give your metric a descriptive name, choose its type (numeric, percentage, or currency), and add a brief description if needed.
You need to construct your metric with a formula, utilizing existing metrics or exploring categories for inspiration. Finally, you can then specify who has access to it.
Accessing Your Custom Facebook Ad Metrics
Once created, your custom metric will be visible in the list of available metrics for column customization. Simply check the box next to it to add it to your report.
Hover over the metric to view details like the formula and its creator. You can edit or delete it if necessary.
Remember, any custom metrics you create in Ads Manager will also be accessible in Ads Reporting, and vice versa.
Ideas for Custom Metric Usage
The possibilities are vast! If you find yourself manually calculating metrics or using external formulas, custom metrics can be a game-changer, offering valuable insights beyond Facebook's default reports.
Actionable Insights and Optimization Strategies
By analyzing your Facebook Ad metrics, you can identify areas for improvement and implement data-driven optimization strategies:
- A/B Testing: Test different ad variations to identify the most effective messaging, visuals, and calls to action.
- Budget Allocation: Allocate your ad spend strategically based on the performance of different ad sets and campaigns.
- Bidding Strategies: Optimize your bidding strategies to achieve the most cost-effective results for your campaign goals.
- Targeting Optimization: Refine your audience targeting based on insights into demographics, interests, and behaviors.
Common Challenges with Advertising Performance Metrics
Low Ad Engagement
If your Facebook engagement feels like it's taken a nosedive, take a deep breath—it's not time to hit the panic button just yet.
The recent tweaks to the Facebook algorithm might be sending shockwaves through the marketing world, but fear not, it's not as ominous as it seems. The key lies in reevaluating your approach to metrics such as likes, comments, and shares.
The days of engagement bait and spammy tactics are numbered, and Facebook is actively discouraging posts that beg for engagement. To navigate this new terrain, you need a solid Facebook engagement strategy.
Don't worry; you don't have to reinvent the wheel. You simply need to fine-tune your posts to maximize engagement.
How to make your ads engaging?
- Give video ads the spotlight they deserve.
- Don't forget about Stories ads—they're your secret weapon.
- Select your images thoughtfully; let them tell your story.
- Place and craft your text with finesse; short and sweet is the way to go.
- Craft an offer that's impossible to resist.
- Let the numbers shine—transparency is key.
- Nail it with a compelling call-to-action (CTA).
Ad High Frequency
Ad frequency tells you how often a unique user has seen your ad. Picture it like this: an ad frequency of four means that each viewer has seen your ad around four times on average.
Why does Ad Frequency matter?
It helps you gauge if you're bombarding the same audience repeatedly or spreading your ad budget a bit too thin.
Common knowledge suggests that, on average, people need to see your ad more than once to remember it and take action. But here's the catch: as the frequency climbs, the effectiveness of your ad takes a hit.
What's the ideal ad frequency?
While there's no one-size-fits-all answer, our recent study, analyzing over 10,000 ads across various accounts, gives us some interesting insights.
Check out our study on ad frequency versus average cost per acquisition. See those trends? The sweet spot for ad frequency is between 1.8 and 4 views on average. Beyond that, the cost per acquisition (CPA) starts climbing.
How to Manage Your Facebook Ads Frequency with an Awareness Campaign?
Ready to enhance your campaign's performance? Follow these easy steps with a smile!
- Head over to your Meta Ads Manager.
- Kickstart a fresh campaign and, for a dash of awareness, choose "Awareness" as your objective.
- Glide to the Ad-Set level, locate the Performance goal, and tap to unveil more options.
Step 4: Get comfy and adjust your Frequency cap.
Now, here's where the magic happens! You have the power to fine-tune how many daily impressions you serve. As for the golden frequency cap, it's all about your campaign's vibe.
We suggest aiming for at least 5 impressions every 7 days. Why? Studies say that hitting this magic number increases the likelihood of turning a casual viewer into a loyal customer for your fantastic products or services. So, go ahead, tweak that frequency cap, and let the impressions roll in!
High CPC (Cost Per Click)
CPC, or cost per click, is crucial for managing your Facebook ad campaign expenses. It's the cost incurred each time someone clicks on your ad, and several factors contribute to its dynamics.
The content of your ad plays a pivotal role, but it's not the sole determinant.
Ad quality and relevance are essential, reflecting how your audience reacts to the advertisement. The targeting of your ads matters too, as it defines who sees them. The placement of your ads —whether they appear in the news feed, sidebar, or mobile—also influences CPC.
Additionally, how you optimize your ad delivery, whether for clicks, impressions, or daily unique reach, affects the cost per click.
Now, if you're aiming to optimize your ad campaign and reduce costs, here are 17 effective tactics to lower your Facebook Ad CPC:
- Run experiments with different campaign objectives.
- Fine-tune your ad targeting for better precision.
- Avoid overlapping audiences to enhance targeting effectiveness.
- Utilize diverse images and videos to captivate your audience.
- Calculate your estimated action rate for strategic planning.
- Include a compelling call-to-action (CTA) to drive engagement.
- Focus on selling the click rather than the product upfront.
- Increase your ad click-through rate (CTR) through engaging content.
- Segment your ad campaign by device for tailored optimization.
- Implement the Facebook ad pixel to track user interactions.
- Optimize your ad landing pages for higher conversion rates.
- Create custom audiences for more targeted ad delivery.
- Leverage influencer partnerships for expanded reach.
- Conduct split tests on ad creative and ad sets for optimization.
- Utilize dynamic ad creative for personalized user experiences.
- Take advantage of the "Use Existing Post" feature for efficient content reuse.
- Empathize with your customers, aligning your messaging with their needs and preferences.
Navigating Metrics with Two Owls
Embarking on a Facebook advertising journey?
Buckle up, because tracking metrics is like having a GPS for your campaign success. It's not just about those clicks; it's about understanding the intricate dance between engagement, conversions, and every pixel in between.
We get it, though; diving into the metrics jungle can be a challenge – but fear not! Two Owls swoops in like a digital superhero, offering not just a solution but a friendlier, simpler way to decipher the data puzzle.
Who said tracking metrics couldn't be both insightful and fun?
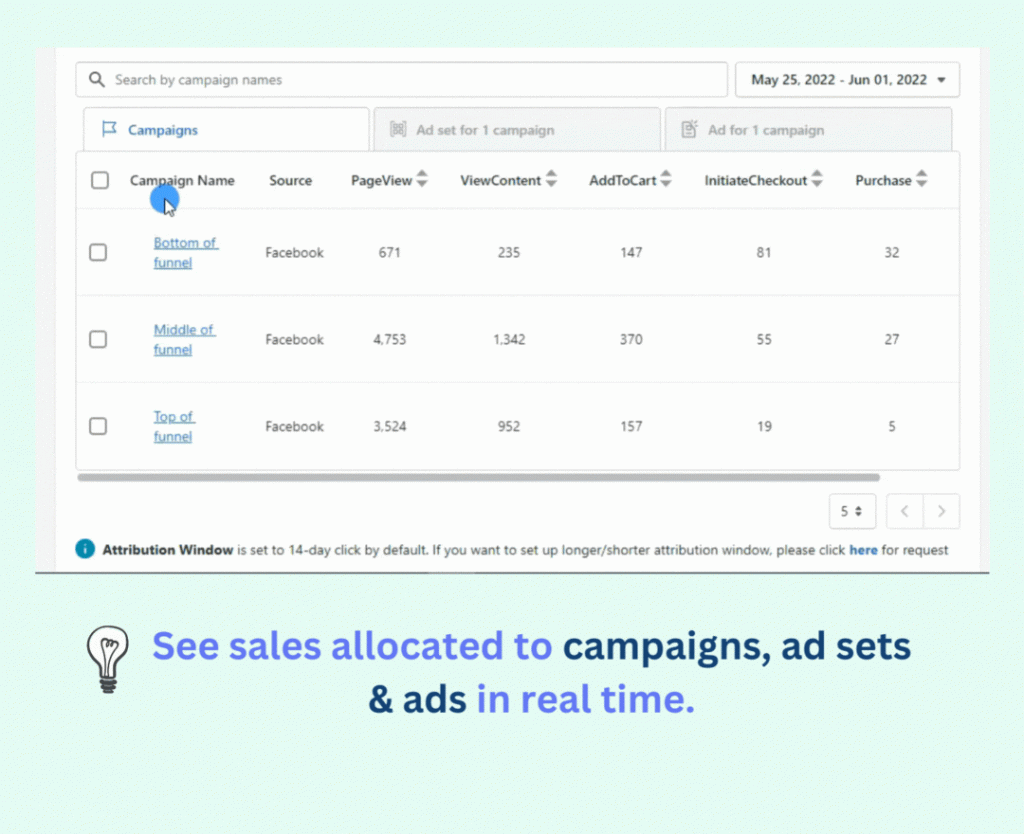
For those tired of waiting for Facebook to reveal which ads got the sales in Ads Manager or can't stand delays and inaccurate attribution to the campaigns, Two Owls' Omega Ads Attribution Report is the game-changer.
Simply add your UTM string to the UTM parameter box at the ad level (you can see detailed instructions HERE), and voila! (learn more about Facebook ad UTM parameters). Two Owls breaks down the values in the links when your visitors first land on your site from the ads and ties their actions to the right campaign, ad sets, and ads – making tracking as easy as a walk in the park.
But wait, there's more! Two Owls brings you timely and accurate attribution, allowing you to know precisely which ads, ad sets, and campaigns drove the sales, and even higher funnel events like page views, add to carts, and initiate checkouts – all with the flexibility to filter back for as far as 60 days.
Conclusion
In the ever-evolving landscape of digital advertising, mastering Facebook Ad metrics is essential for achieving sustainable success. By understanding the different types of metrics, aligning them with your campaign objectives, and utilizing the insights they provide, you can optimize your strategies, maximize your ROI, and achieve your marketing goals. Remember, the key to success lies in continuous monitoring, analysis, and adaptation based on the data at your fingertips.
With Two Owls, it’s like a dream come true where no more wasted delaying time, and no more annoying incorrect data! You can focus on and only on the big picture and leave the rest to us! Tracking metrics becomes not just a necessity but a delightful journey into the heart of your advertising success.
How to Boost a Post on Facebook in a Quick and Easy Way
What are Facebook Pixel Events? What to Track with Them?
![Why Facebook Ads Payment Failed? Here's How To Fix It [2024]](https://twoowls.io/wp-content/uploads/2024/07/facebook-ads-payment-failed.jpg)
Why Facebook Ads Payment Failed? Here's How To Fix It [2024]
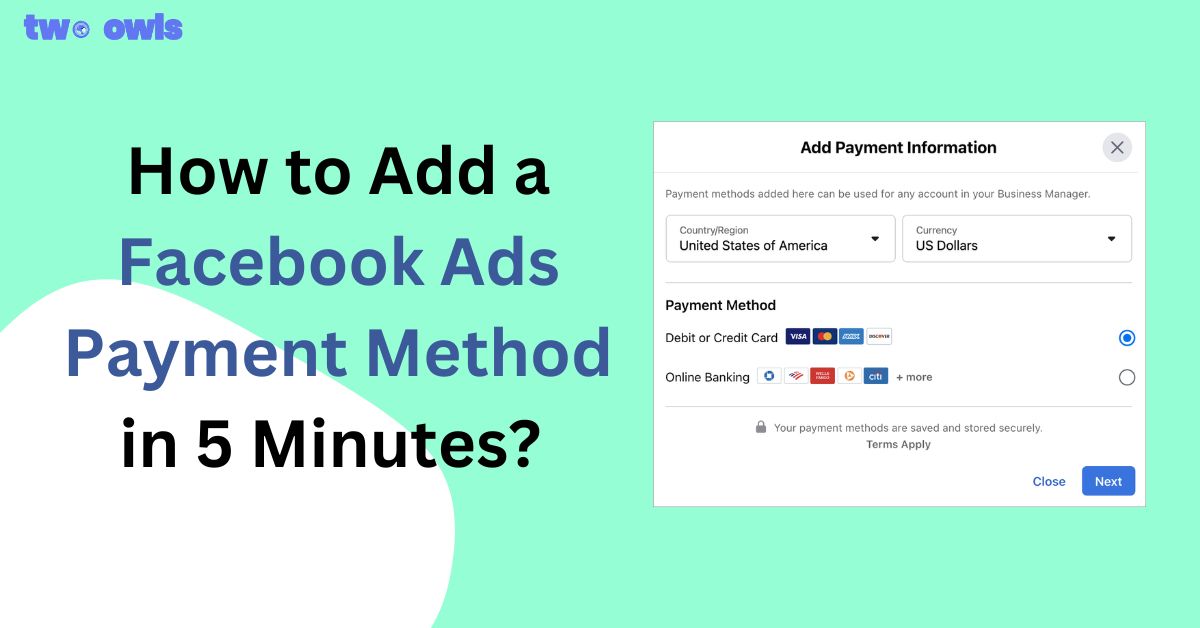
How to Add a Facebook Ads Payment Method in 5 Minutes?
