Stop Guessing, Start Scaling: Introducing Omega TikTok Pixel’s New Conversion Analytics


As a TikTok advertiser, you know the drill. You log into your dashboard, see your conversions dropping, and immediately start asking yourself: Why aren't more visitors becoming customers?
Your TikTok Pixel tells you what happened, but it rarely tells you why. Instead of digging through messy spreadsheets and guessing where your ad budget is leaking, you need instant, actionable insights.
That’s exactly why we built Conversion Analytics for Omega TikTok Pixels.
We are turning raw data into clear, goal-based insights so you can stop playing guessing games with your ad budget and start scaling what actually works.
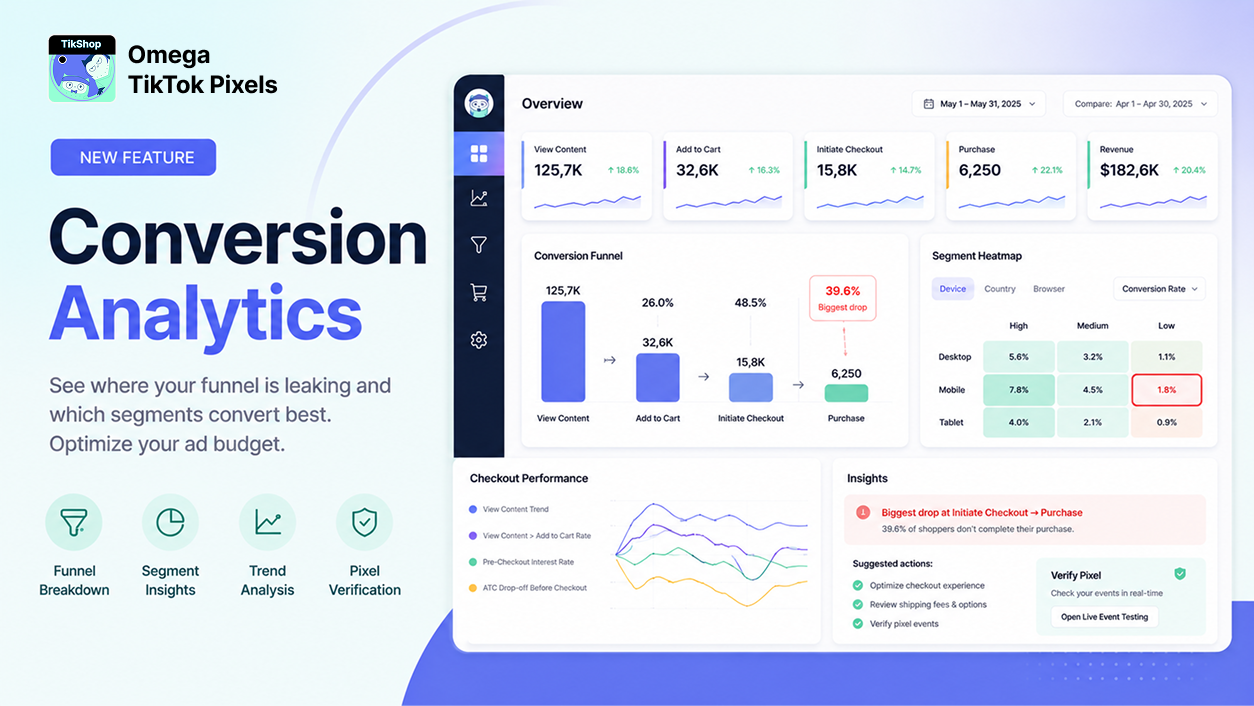
What is Conversion Analytics?
Omega Conversion Analytics doesn't just show you numbers; it maps out your entire Shopify store's funnel, highlights where shoppers are dropping off, and gives you concrete recommendations on what to do next.
Available now on our Paid Plan, this update introduces two powerful dashboards: User Behavior and Checkout Performance.
Here is how it helps you turn data into daily revenue:
1. Metric summary & trend chart
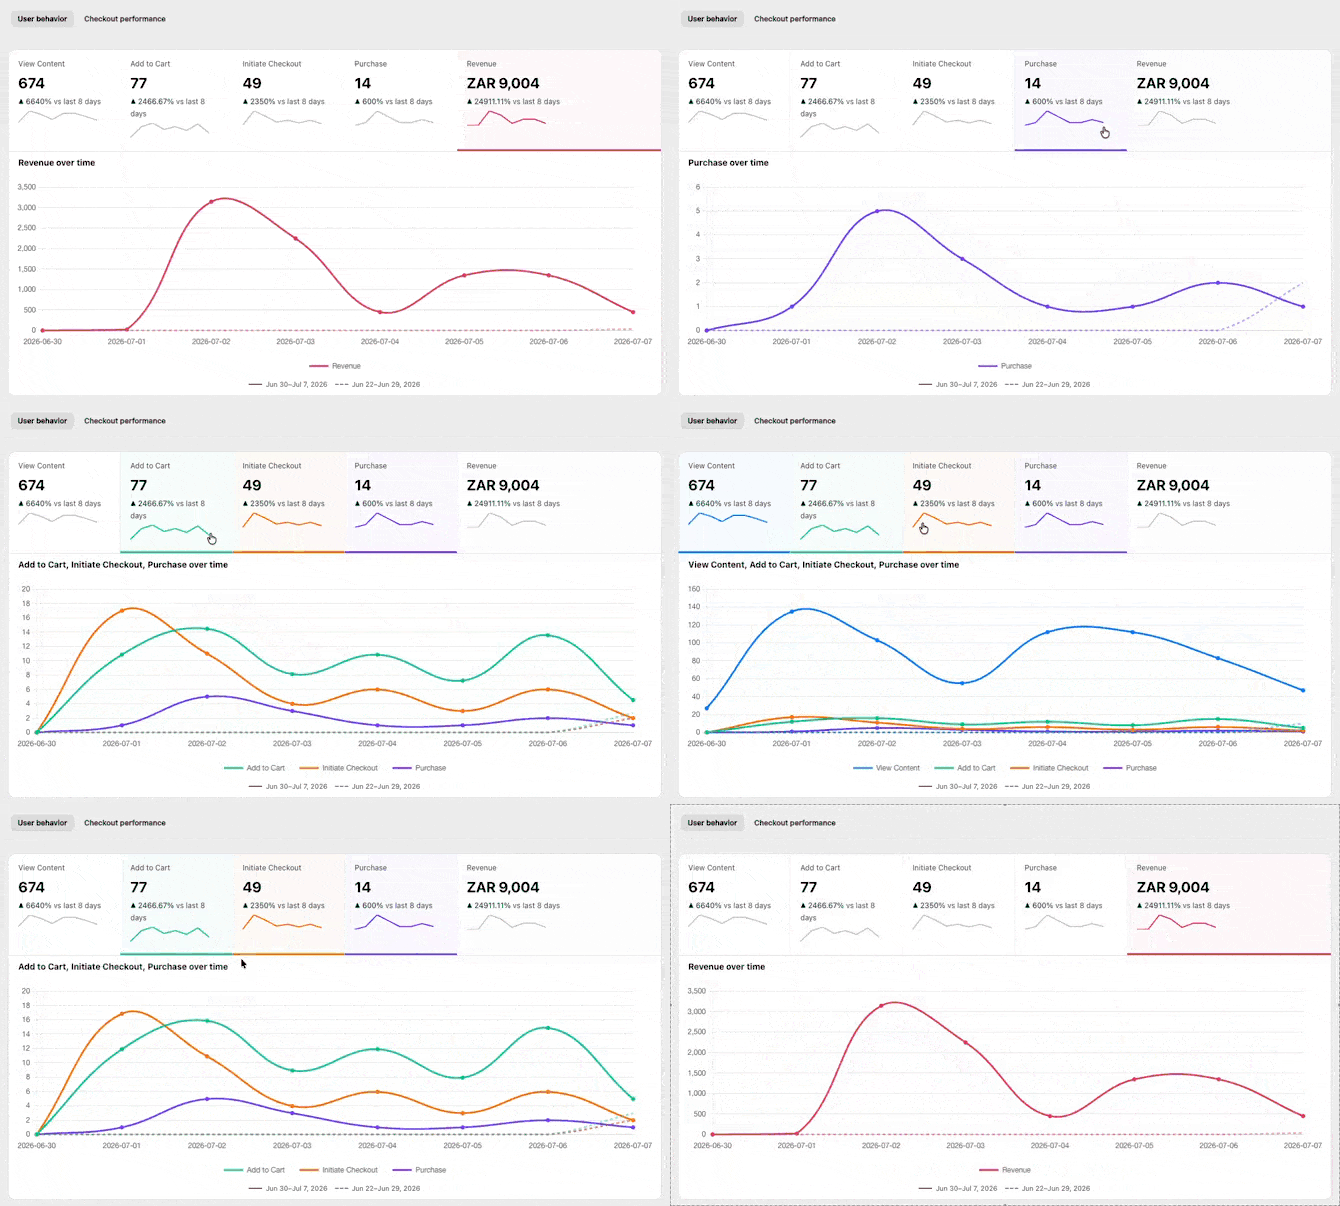
At the very top of your dashboard, you get an instant health check of your core funnel metrics: View Content, Add to Cart, Initiate Checkout, Purchase, and Revenue. Each metric displays its total volume, percentage change against the previous period, and a mini trend line.
The Power Move: Want to see how a sudden spike in product views impacts actual purchases over time? Click multiple metrics to overlay their trend lines side-by-side on the main chart. To keep your data clean and readable, counts and revenue use separate axes, and your previous-period data is plotted as a dashed line for effortless benchmarking.
2. Find and Plug Your Funnel Leaks
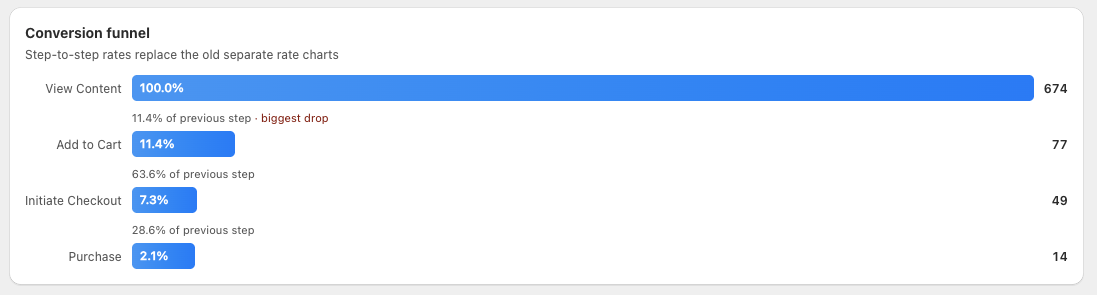
The Conversion Funnel chart maps your customer journey: View Content → Add to Cart → Initiate Checkout → Purchase.
- The Magic Feature: Omega automatically highlights the exact step with the biggest drop-off in red.
- The Fix: No more guessing if your product page or your shipping costs are the problem. You'll know exactly where to focus your optimization efforts.
3. Double Down on Your Best Audiences (Segment Heatmap)
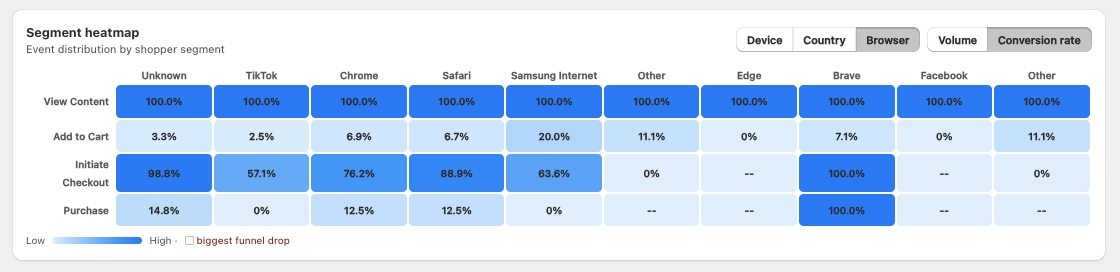
Ever wonder if your mobile traffic from the UK converts better than desktop traffic from the US? The new Segment Heatmap breaks down your funnel by Device, Country, and Browser.
- Toggle between raw volume and conversion rates.
- Darker cells mean higher values, while the steepest drop is outlined in red.
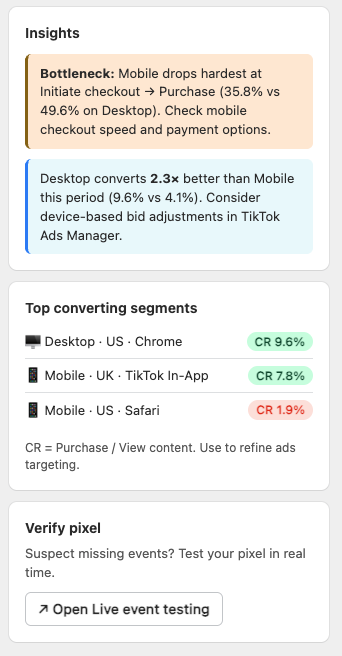
- The Fix: Use the Top Converting Segments sidebar to see your highest-converting combinations, then head to TikTok Ads Manager to scale those bids and cut the budget on what's losing money.
4. Smart Insights & Instant Action Items
On the right side of your dashboard, you'll find Auto-Generated Insights. Instead of just showing a drop-off, Omega gives you advice like: "Desktop drops most at Initiate Checkout → Purchase - check checkout speed and payment options."
👉 Learn more about Omega Conversion Analytics
💡 Quick Tips: How to Act on This Data Today
Fix the biggest drop first: Look at the highlighted red step in your funnel. Drops at the checkout stage usually mean you need more payment options (like Shop Pay or PayPal) or your shipping fees are too high.
Compare metrics side-by-side: In the trend chart, click multiple metrics (like Add to Cart and Purchase) to overlay their lines and see how shopping behavior shifts day-to-day.
Don't panic if a step shows > 100%: The funnel counts events, not unique users. If a shopper lands directly on a product page from a TikTok ad and hits "Add to Cart" without a "View Content" event triggering first, the later step might look larger. This is completely normal behavior!
Stop wasting ad spend on blind optimizations. Get the clarity you need to scale your store with confidence.

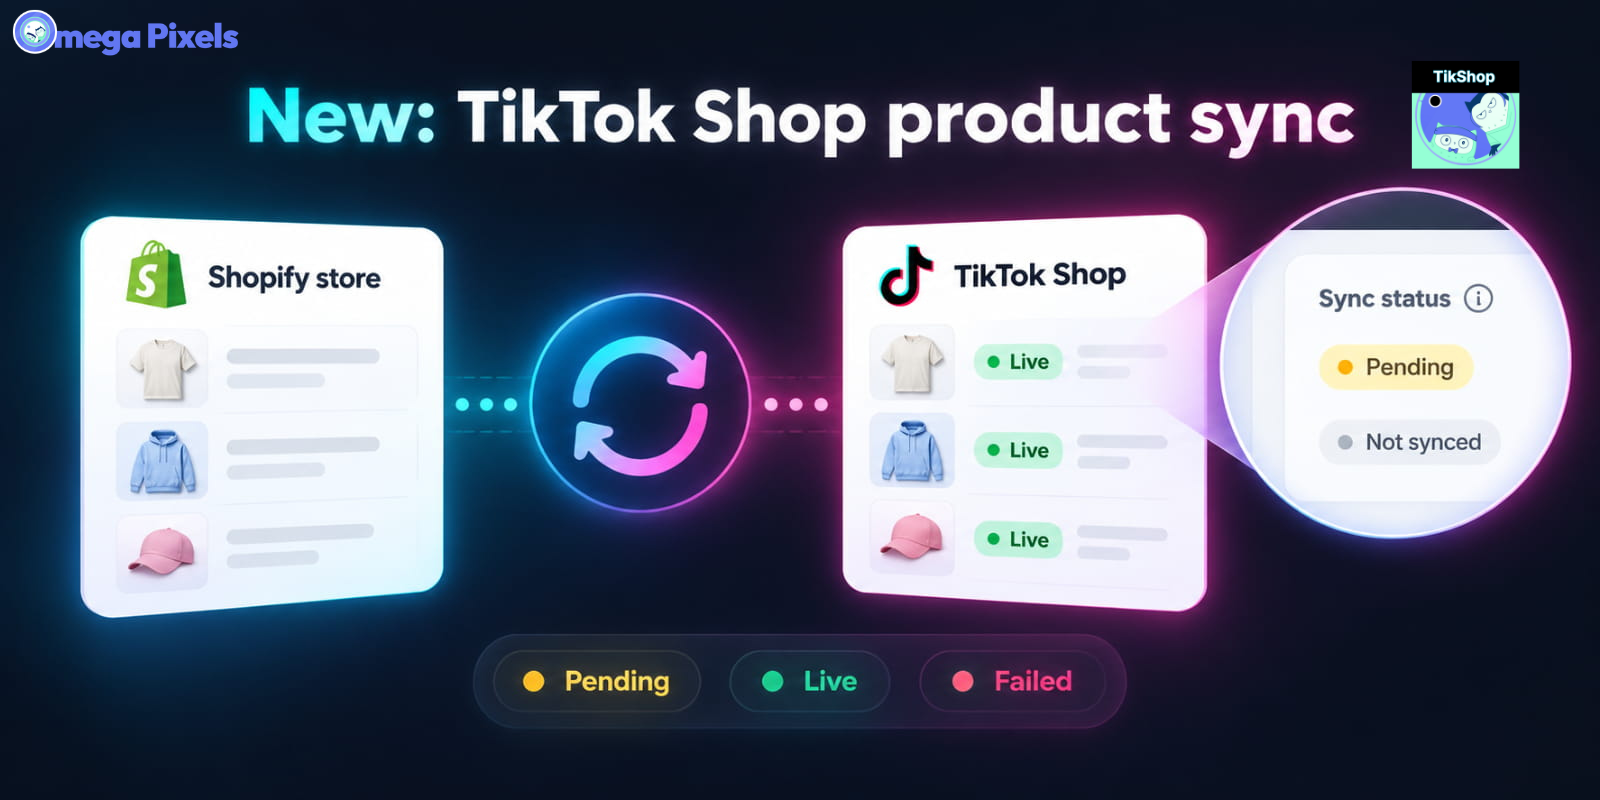
Sync Shopify Products to TikTok Shop directly with Omega TikTok Pixels

Transform Wix Storefronts with Shoppable Instagram Galleries: Omega Instagram Feed Launch

Stop Bots From Training Your Meta Ads: Introducing Bot & Fraud Protection
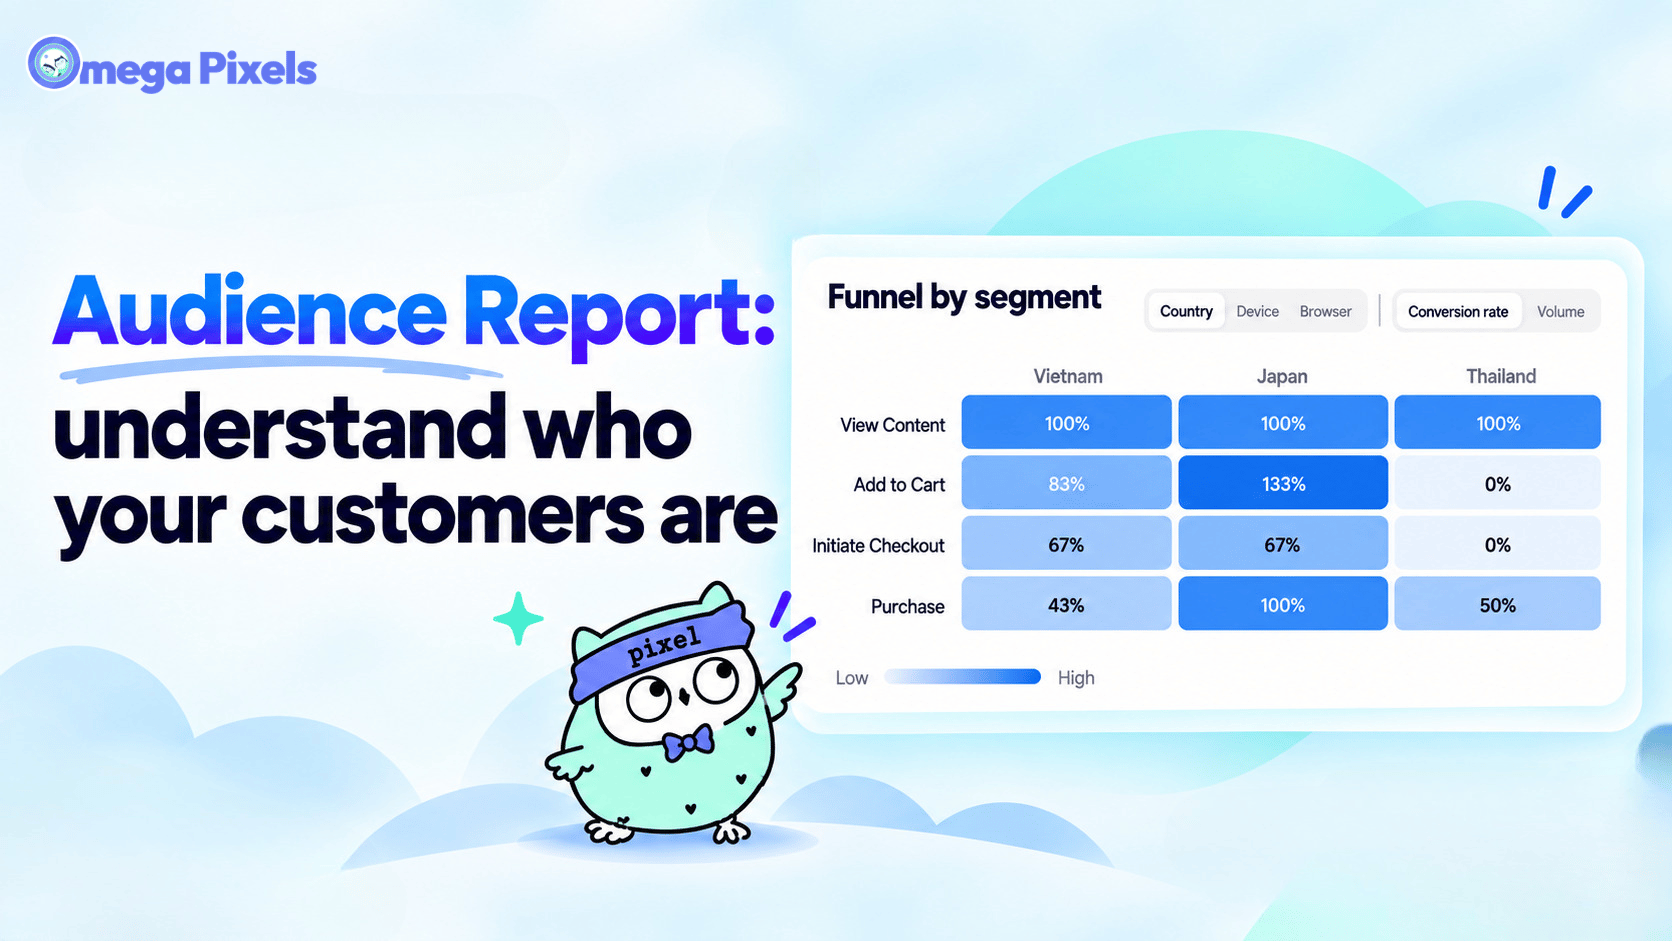
New in Omega Facebook Pixel: Audience Report
Sync Shopify Products to TikTok Shop directly with Omega TikTok Pixels
Transform Wix Storefronts with Shoppable Instagram Galleries: Omega Instagram Feed Launch
Stop Bots From Training Your Meta Ads: Introducing Bot & Fraud Protection
New in Omega Facebook Pixel: Audience Report
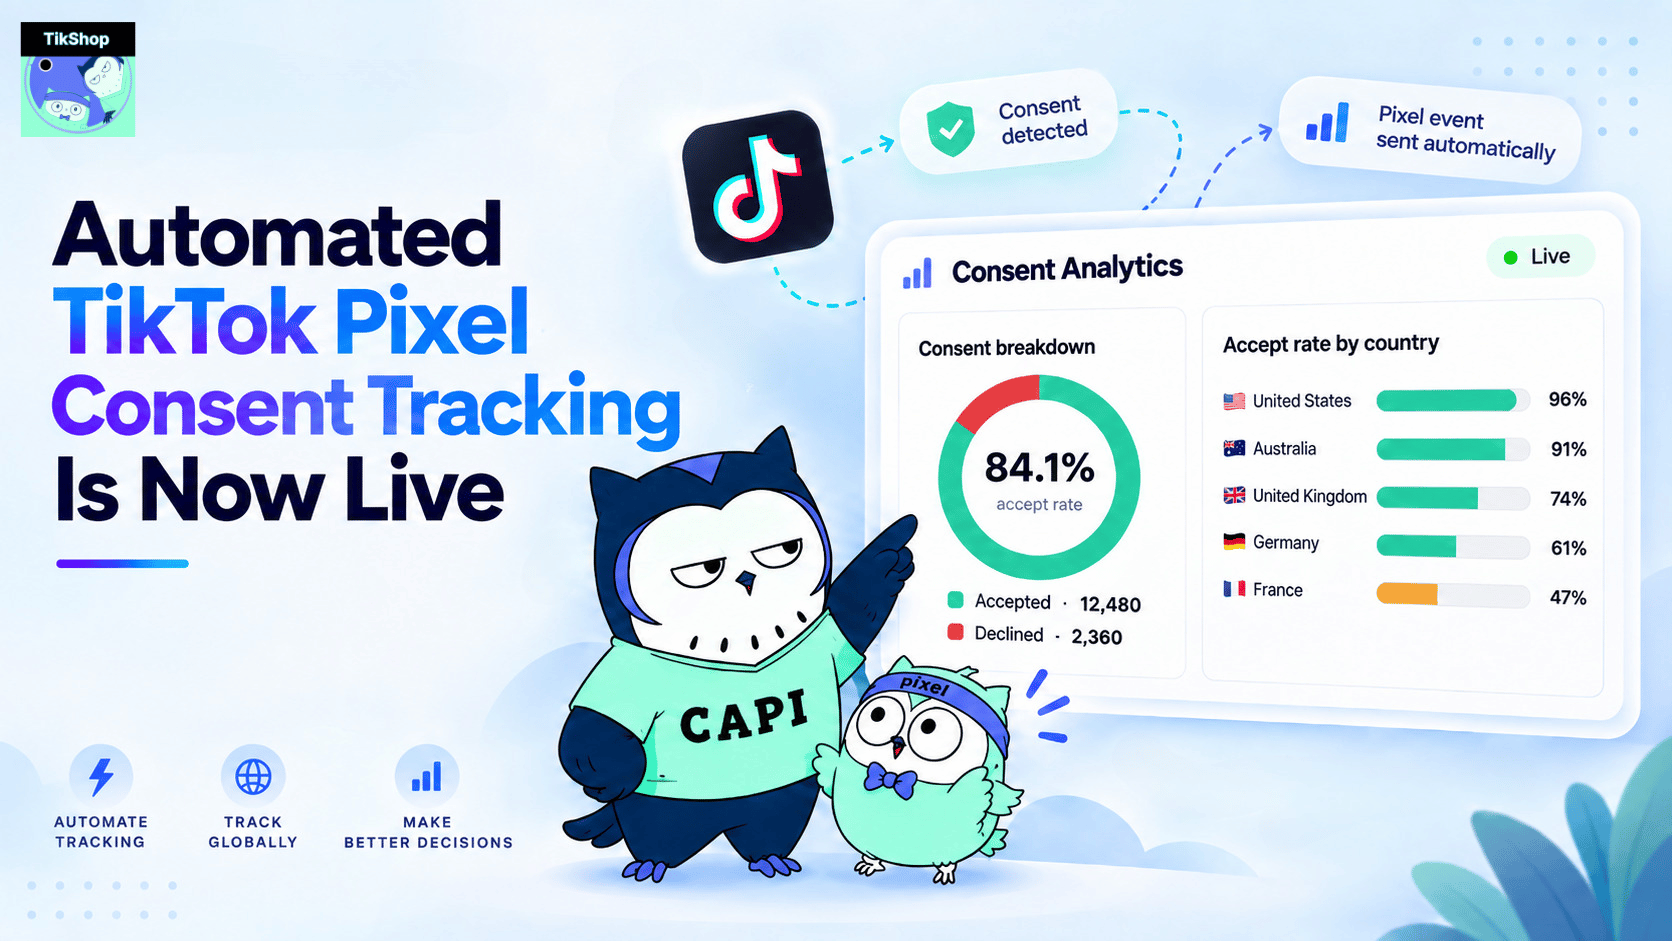
Automated TikTok Pixel Consent Tracking Is Now Live
Sync Shopify Products to TikTok Shop directly with Omega TikTok Pixels
Transform Wix Storefronts with Shoppable Instagram Galleries: Omega Instagram Feed Launch
Stop Bots From Training Your Meta Ads: Introducing Bot & Fraud Protection
New in Omega Facebook Pixel: Audience Report